








Policy Update
Divya Natarajan
Background
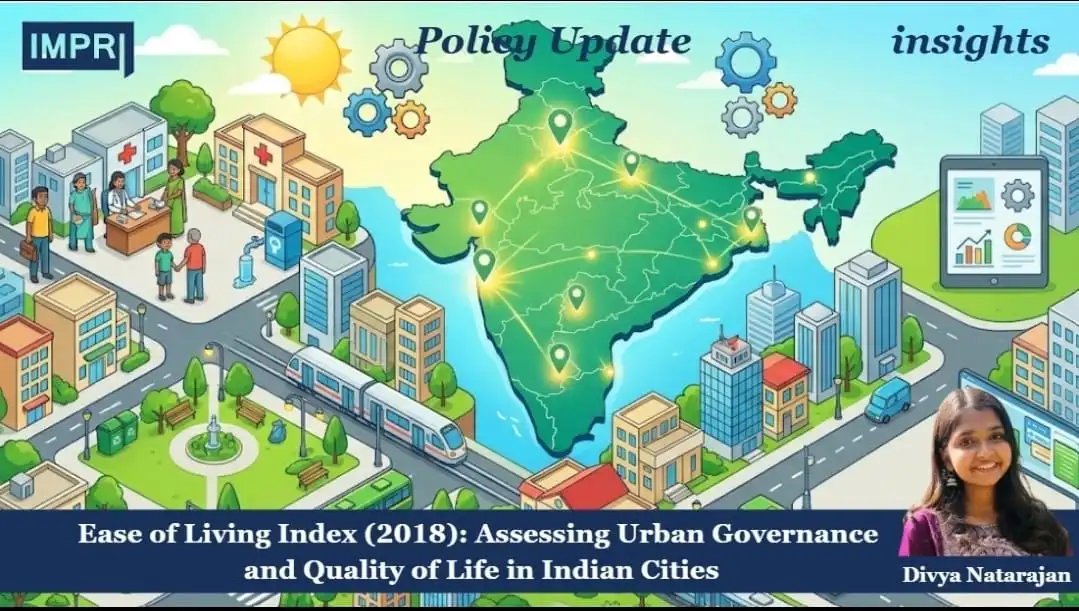
The Ease of Living Index (EoLI) is a Ministry of Housing and Urban Affairs (MoHUA) assessment tool designed to help Indian cities evaluate themselves against global and national benchmarks and to encourage a shift toward outcome-based urban planning and management. MoHUA launched the first edition on August 13, 2018, describing it at the time as more than just a ranking exercise, an open and participatory assessment combining self-reported data with physical audits of urban metrics, intended to create a baseline for evidence-based urban policy debate (PIB, 2018).
The Ministry has been candid that “ease of living” itself has no single, standard, agreed-upon definition: for some observers it is tied primarily to physical amenities such as water supply, solid waste management, and green space, while for others it relates to cultural offerings, career opportunities, economic dynamism, or public safety (PIB, 2018). Rather than resolve this ambiguity, the 2018 Index attempted to combine these different facets into a common framework that individual cities could use to self-assess.
The first edition covered 111 cities, a group comprising the 100 cities selected under the Smart Cities Mission, all state capitals, and a small number of other cities with a population above one million (Drishti IAS, 2018). Cities were assessed against 78 indicators grouped into four pillars, Institutional, Social, Economic, and Physical, a structure discussed in more detail under Functioning below.
The Index needs to be read as part of a broader cluster of urban governance initiatives MoHUA has run since 2015, including the Smart Cities Mission, AMRUT, Swachh Bharat Mission (Urban), and PMAY (Urban), and it is explicitly linked to India’s progress on the Sustainable Development Goals in an urban context (JETIR, 2019). It was also, at launch, described as the first index of its kind attempted at this scale globally, ranking cities within a single country along a common, standardised set of liveability parameters (Athena Infonomics, n.d.).
Functioning
The 2018 edition organised its 78 indicators, of which 56 were classified as core indicators and 22 as supporting indicators, under four pillars.
Table 1: Ease of Living Index 2018, Pillar Structure
| Pillar | What it covers |
| Institutional | Governance quality, public service delivery, and participatory governance mechanisms |
| Social | Education, health, identity, culture, and public safety |
| Economic | Economic growth potential, employment opportunities, and inclusiveness of economic development |
| Physical | City infrastructure, including housing, transportation, waste management, and environmental sustainability |
Source: Ministry of Housing and Urban Affairs, Ease of Living Index 2018 framework, as described in Panat and Chandra (2025).
Cities self-reported data against these indicators, which MoHUA and its assessment partners then validated, in part, through physical audits, an attempt to reduce the risk of cities simply reporting favourable figures without independent verification (PIB, 2018). Rankings were released for the full set of 111 participating cities, without the population-based sub-categorisation that MoHUA would later introduce in the 2020 edition.
In its second edition, released as Ease of Living Index 2020 alongside a newly introduced companion index, the Municipal Performance Index (MPI), MoHUA revised the assessment architecture. The 2020 EoLI was restructured around four pillars, with a newly added Citizen Perception Survey component, split across 14 categories and 49 indicators.
Table 2: Ease of Living Index 2020, Revised Pillar Structure and Weightage
| Pillar | Weightage | What it covers |
| Quality of Life | 35% | Direct outcomes experienced by residents across housing, health, education, and safety |
| Economic Ability | 15% | Economic growth, employment, and livelihood opportunities within the city |
| Sustainability | 20% | Environmental resilience, green space, and long-term urban sustainability |
| Citizen Perception Survey | 30% | Residents’ own subjective assessment of their quality of life in the city |
Source: Adapted by author from Ministry of Housing and Urban Affairs, Ease of Living Index 2020 (PIB, 2021); Deccan Herald (2021).
The Municipal Performance Index was introduced specifically to separate outcome measurement from input measurement: where the EoLI assesses the outcomes and results a city has achieved, the MPI assesses the enabling inputs, municipal Services, Finance, Planning, Technology, and Governance, that produce those outcomes (PIB, 2021).
The introduction of a 30 percent weighted Citizen Perception Survey in the 2020 edition marked a meaningful methodological shift. While the Physical pillar carried the greatest weight in the 2018 framework at approximately 45 points, the 2020 edition rebalanced the Index toward outcomes and citizen perception. Nearly a third of the final score consequently reflected residents’ subjective assessments of their quality of life, helping bridge the gap between administrative indicators and lived experience that critics had identified in the 2018 edition (Hindustan Times, 2018).
Performance
The 2018 Index ranked cities on a single combined list, without any population-based split.
Table 3: Ease of Living Index 2018, Top and Bottom Ranked Cities
| Rank | City |
| 1 | Pune |
| 2 | Navi Mumbai |
| 3 | Greater Mumbai |
| Last (111th) | Rampur, Uttar Pradesh |
Source: Adapted by the author from Testbook (2026), summarising the MoHUA 2018 report.
For the 2020 edition, released in final form on March 4, 2021, MoHUA introduced a population-based split, evaluating cities separately in a “Million-Plus” category and a “Less than Million” category, on the reasoning that a small town and a metropolitan corporation face structurally different governance and infrastructure challenges (PIB, 2021).
Table 4: Ease of Living Index 2020, Top-Ranked Cities by Category
| Category | Top 3 cities | Bottom-ranked city |
| Million-Plus population | Bengaluru, Pune, Ahmedabad | Srinagar |
| Less than million population | Shimla, Bhubaneswar, Silvassa | Muzaffarpur |
Source: Adapted by the author from Press Information Bureau (PIB, 2021); Deccan Herald (2021).
Bengaluru’s top position drew particular scrutiny in the press, since the city’s lived reputation for traffic congestion, flooding, and civic infrastructure strain sat uneasily against a first-place liveability ranking (Deccan Herald, 2021b). A separate Deccan Herald analysis noted that of the 111 cities assessed in 2020, three cities from Maharashtra alone (Greater Mumbai, Navi Mumbai, and Pune) featured in the national top 10, and seven Maharashtra cities featured in the top 20, a level of geographic concentration among wealthier, already well-resourced states that raises questions about whether the Index primarily reflects genuine governance quality or simply pre-existing regional economic advantage (Deccan Herald, 2021c).
Perhaps the most consequential performance finding concerns the continuity of the Index itself. While no subsequent standalone edition of the Ease of Living Index appears to have been published after the 2020 cycle, MoHUA’s Urban Outcomes Framework (UOF) 2022 incorporated an Ease of Living component covering Quality of Life, Economic Ability, Sustainability, and Citizen Perception Survey (CPS), alongside related data collection. Thus, rather than indicating complete discontinuity, the evidence suggests a shift toward integrating Ease of Living indicators within a broader urban outcomes framework.
Impact
The Index’s clearest, most defensible impact is informational: it created, for the first time, a standardised, comparable, and publicly available dataset on urban governance and quality-of-life outcomes across a large, diverse set of Indian cities. Prior to 2018, no equivalent national baseline existed in a format that allowed direct city-to-city comparison across dozens of indicators simultaneously (PIB, 2018). Academic researchers have used the 2018 dataset for independent reanalysis; one study applying Partial Least Squares Path Modeling to the underlying indicator data found that the statistical weight different facets of urban living actually carried, once modeled empirically, diverged meaningfully from the a priori weightages MoHUA had assigned in the original report, and that this divergence itself varied between large and small cities (RSIS International, 2021). This suggests the Index’s greatest value may lie less in its official rankings than in the underlying, granular indicator data it made publicly available for independent scrutiny and re-analysis.
The 2020 edition’s introduction of the Municipal Performance Index alongside the EoLI represents a conceptual improvement by distinguishing governance inputs from outcomes. Incorporating citizen perception further strengthens this framework by assessing whether improvements in measured indicators are reflected in residents’ lived experiences (PIB, 2021).
At the same time, whatever behavioural or reform impact the Index was designed to generate through inter-city competition and public accountability appears to have been constrained by two factors evident from the data already reviewed. First, the apparent absence of any edition since 2020 means the “healthy competition” mechanism the Index was explicitly designed around, cities improving performance because their relative standing is periodically re-measured and re-published, has not been reinforced through repetition for roughly five years. Second, the concentration of top rankings among cities in already economically advantaged states raises the possibility that the Index has functioned more as a confirmation of existing regional disparities than as a genuine catalyst for underperforming cities to close the gap.
Emerging Issues
First, the Index’s discontinuation after 2020, if confirmed, undermines the entire premise on which it was designed. A liveability index that is not periodically repeated cannot generate the year-on-year competitive pressure it was built around, and it cannot demonstrate whether cities that ranked poorly in 2018 or 2020 have since improved. Five years is a long gap for an index whose stated purpose was to drive continuous, evidence-based urban policy reform.
Second, the definitional ambiguity MoHUA itself acknowledged at launch, that “ease of living” has no standard, agreed definition, creates a genuine methodological tension that later editions only partly resolved. Combining institutional, social, economic, and physical indicators into a single composite score requires assigning relative weights to fundamentally different kinds of city performance, and independent reanalysis of the 2018 data found that these a-priori weights did not match what a purely empirical, data-driven weighting scheme would have produced (RSIS International, 2021). This means a city’s published rank may say as much about MoHUA’s chosen weighting scheme as about its actual, lived quality of life.
Third, the gap between official rankings and residents’ lived experience, most visibly illustrated by Bengaluru’s first-place finish in the 2020 Million-Plus category despite widespread, well-documented public frustration with the city’s traffic congestion and civic infrastructure, points to a deeper measurement problem (Deccan Herald, 2021). The 2020 edition’s introduction of a 30 percent weighted Citizen Perception Survey was a direct methodological response to this criticism, but a perception survey’s results depend heavily on sampling methodology, respondent selection, and survey administration quality, none of which are fully transparent in publicly available MoHUA communications, making it difficult for an outside observer to independently verify how representative the survey component actually was.
Fourth, the apparent concentration of top-ranked cities in a small number of already economically advantaged states, Maharashtra alone placed three cities in the 2020 national top 10 (Deccan Herald, 2021), raises the question of whether the Index primarily measures genuine differences in municipal governance quality, or whether it substantially reflects pre-existing regional economic advantage that would show up on almost any composite urban indicator regardless of specific governance interventions. Without controlling for baseline regional wealth, a ranking exercise risks rewarding already-advantaged cities rather than identifying genuinely well-governed ones.
Finally, the Index’s coverage, 111 cities in both the 2018 and 2020 editions, represents a small fraction of India’s more than 4,500 Urban Local Bodies. This is a deliberate design choice, focusing on Smart Cities Mission cities, state capitals, and larger urban centres, but it means the vast majority of India’s smaller towns and municipalities have never been assessed under this framework, limiting the Index’s usefulness as a genuinely national picture of urban liveability.
Way Forward
First, MoHUA should either resume the Ease of Living Index on a regular, predictable cycle, ideally every two to three years, or formally state that the initiative has been discontinued or superseded by a successor framework. An extended, unexplained silence since 2020 leaves researchers, city governments, and the public unable to distinguish between a paused initiative and a permanently shelved one.
Second, future editions should publish the underlying methodology and weighting rationale in enough technical detail to allow independent verification, particularly given that independent academic reanalysis of the 2018 data found the official a priori weights diverged from what empirical modelling would have produced (RSIS International, 2021). Greater methodological transparency would strengthen confidence in the rankings’ validity.
Third, the Citizen Perception Survey component introduced in 2020 should be accompanied by published sampling methodology, response rates, and demographic breakdowns of respondents, so that its 30 percent weighting in the final score can be properly evaluated for representativeness rather than taken on trust.
Fourth, future editions should consider presenting rankings alongside, or adjusted for, baseline regional economic indicators, so that genuinely well-governed cities in less economically advantaged states or regions can be identified and recognised, rather than being structurally disadvantaged relative to already-wealthy metropolitan regions.
Finally, MoHUA should consider a phased expansion of coverage beyond the current 111 cities, even a staggered rollout to a few hundred additional mid-sized towns over successive editions would substantially improve the Index’s claim to represent a genuinely national picture of urban liveability, rather than one concentrated on India’s largest and already most closely watched cities.
References
- Press Information Bureau (PIB), Ministry of Housing and Urban Affairs, Government of India. (2018, August). Ease of Living Index to Empower Citizens in Aspiring for a Better Quality of Life from their City Authorities. https://www.pib.gov.in/PressReleasePage.aspx?PRID=1543145®=3&lang=2
- Press Information Bureau (PIB), Ministry of Housing and Urban Affairs, Government of India. (2021, March 4). Bengaluru, Pune, Ahmedabad best cities in EoLI 2020 (Million Plus Category). https://www.pib.gov.in/PressReleasePage.aspx?PRID=1702417®=48&lang=2
- Drishti IAS. (2018). Ease of Living Index. https://www.drishtiias.com/daily-updates/daily-news-analysis/ease-of-living-index
- Deccan Herald. (2021a, March). Bengaluru tops Ease of Living Index, Pune ranks second. https://www.deccanherald.com/india/karnataka/bengaluru/bengaluru-tops-ease-of-living-index-pune-ranks-second-957977.html
- Deccan Herald. (2021b). Cry, the beloved city. https://www.deccanherald.com/amp/story/opinion%2Fcry-the-beloved-city-966025.html
- Deccan Herald. (2021c). The reality behind Bengaluru’s Ease of Living ranking. https://www.deccanherald.com/amp/story/opinion%2Fthe-reality-behind-bengalurus-ease-of-living-ranking-967697.html
- Hindustan Times. (2018, August 15). The ease of living index is welcome, but has flaws. https://www.pressreader.com/india/hindustan-times-delhi/20180815/282166472020501
- JETIR (Journal of Emerging Technologies and Innovative Research). (2019). Ease of Living Index and its Components. https://www.jetir.org/papers/JETIR1906J67.pdf
- Athena Infonomics. (n.d.). Ease of Living Index. https://www.athenainfonomics.com/projects/ease-of-living-index
- RSIS International. (2021). India’s Ease of Living Index Report 2018: A data driven approach. International Journal of Research and Scientific Innovation, 8(3), 78-83. https://rsisinternational.org/journals/ijrsi/digital-library/volume-8-issue-3/78-83.pdf
- Panat, T., & Chandra, R. (2025, February 8). Global Ease of Living Index: a machine learning framework for longitudinal analysis of major economies. arXiv. https://arxiv.org/abs/2502.06866
- Testbook. (2026, July 8). According to the Ease of living Index report released by Ministry of Housing and Urban Affairs. https://testbook.com/question-answer/according-to-the-ease-of-living-index-report-relea–63773f6e8ec0156603e68af8
About the Contributor
Divya Natarajan is a Research and Editorial Intern at IMPRI and a recent Economics graduate from Stella Maris College, Chennai. She has experience in public policy research, editorial writing, and policy analysis through internships with think tanks and research organisations. Her interests include public policy, governance and development economics.
Acknowledgements
I would like to extend my gratitude to IMPRI for this opportunity, constructive reviews and editorial support.
Reviewers
Arjya Shree Pande and Gargi Bisht
Disclaimer
All views expressed in the article belong solely to the author and not necessarily to the organisation.
Read More at IMPRI :
India Electric Mobility Index 2025: Measuring State-Level Progress in Electric Mobility.
Sustainable Agrarian Mission on Use of Agro-Residue in Thermal power Plants (SAMARTH), 2021