






Policy Update
Ravirala Lahari
Background
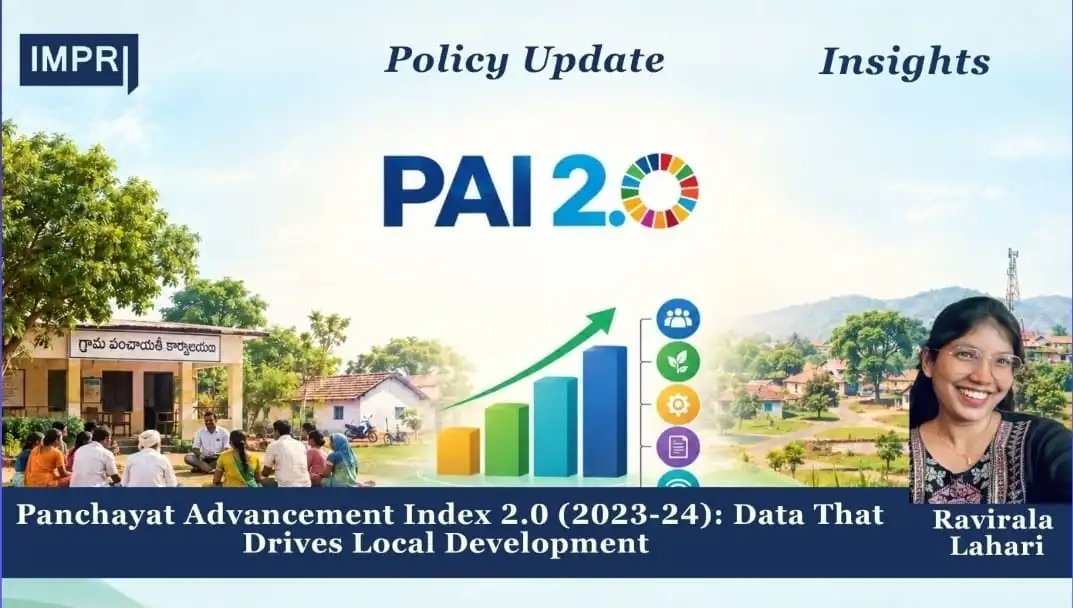
The 73rd Constitutional Amendment Act, 1992 gave Panchayati Raj Institutions constitutional status, and the Eleventh Schedule lists 29 subjects for devolution to them. Over 2.5 lakh panchayats and about 24 lakh elected representatives now operate under this framework, and women make up roughly half of those representatives. What the system lacked for three decades was a common yardstick for how panchayats are performing. The Panchayat Advancement Index (PAI) fills that gap. It translates the 17 Sustainable Development Goals into 9 localised themes (LSDGs) and scores each Gram Panchayat (GP) on them.
Shift from PAI 1.0 to PAI 2.0
While PAI Version 1.0 established the baseline for evidence-based tracking with 516 indicators and 794 data points, it faced operational complexity and heavy administrative burden at the grassroots level. To address these hurdles, PAI 2.0 underwent a comprehensive rationalization, streamlining the metrics down to 150 objective indicators and 230 data points. The Ministry of Panchayati Raj (MoPR) released the PAI 2.0 report for FY 2023–24 on National Panchayati Raj Day, 24 April 2026, under the theme “Sashakt Panchayat, Sarvangeen Vikas”. This alignment significantly improved usability and established direct synchronization with the National Indicator Framework (NIF) and the National Panchayat Awards(Panchayat Advancement Index (PAI) 2.0 Report Out: 3635 Panchayats Emerge as Front Runners, PIB).
Functioning
The methodology of the Panchayat Advancement Index (PAI) 2.0 uses a normalized, objective scoring model on a composite 0-100 scale to evaluate rural local bodies across nine localized Sustainable Development Goal (LSDG) themes. Performance across 150 indicators and 230 data points is calculated using minimum-maximum normalization and weighted averages.
The data collection and portal flow rely on a hybrid acquisition model featuring direct auto-porting from central ministry databases (such as e-GramSwaraj, Jal Jeevan Mission, Poshan Tracker, and MGNREGS) alongside a single integrated entry form for ground-level metrics. Data entered on the PAI Portal (pai.gov.in) undergoes automated soft-validation rules to correct logical errors and outliers before undergoing mandatory Gram Sabha validation for public audit and ratification. Once ratified by the Gram Sabha, the data moves through sequential multi-tiered administrative reviews by Block and District Nodal Officers, generating real-time performance scorecards and national analytics dashboards.
Table 1: Thematic Matrix- LSDGs, Indicator Allocation & Core Objectives
| Theme | Theme Name | Vision & Scope | Indicators | Key Integrated SDGs |
| Poverty Free and Enhanced Livelihoods in Panchayat | Measures sustainable livelihoods, rural employment, skill development, and financial inclusion. | 14 | SDG 1 (No Poverty), SDG 8 (Decent Work) | |
 | Healthy Panchayat | Assesses maternal and child health, immunization, preventive care, and nutrition services. | 15 | SDG 3 (Good Health & Well-being) |
 | Child-Friendly Panchayat | Evaluates child education, school enrollment, protection, child rights, and nutrition. | 15 | SDG 4 (Quality Education) |
 | Water Sufficient Panchayat | Monitors clean drinking water access, tap connections, water conservation, and rainwater harvesting. | 10 | SDG 6 (Clean Water & Sanitation) |
 | Clean and Green Panchayat | Measures solid and liquid waste management, renewable energy usage, and green cover maintenance. | 11 | SDG 12 (Responsible Consumption), SDG 13 (Climate Action), SDG 15 (Life on Land) |
 | Panchayat with Self-Sufficient Infrastructure | Tracks civic infrastructure, digital connectivity, all-weather road access, and Panchayat Bhawan amenities. | 18 | SDG 9 (Industry, Innovation & Infrastructure), SDG 11 (Sustainable Cities & Communities) |
| Socially Just and Socially Secured Panchayat | Assesses social security coverage, support for vulnerable groups (SC/ST/PwD/elderly), and social justice initiatives. | 20 | SDG 10 (Reduced Inequalities), SDG 16 (Peace, Justice & Strong Institutions) |
| Panchayat with Good Governance | Evaluates citizen service delivery, digital transparency, Gram Sabha frequency, and Own Source Revenue (OSR) generation. | 26 | SDG 16 (Peace, Justice & Strong Institutions) |
 | Women Friendly Panchayat | Tracks female political participation, safety, gender-budgeting, maternal healthcare, and SHG economic empowerment. | 21 | SDG 5 (Gender Equality) |
Source: Panchayat Advancement Index (PAI 2.0) FY 2023-24 Report, Ministry of panchayat raj
Performance
Panchayats are classified into five categories based on composite scores on a 0-100 scale: Achiever (A+: ≥90), Front Runner (A: 75-89), Performer (B: 60-74), Aspirant (C: 40-59), and Beginner (D: <40). The exercise achieved an unprecedented 97.30% national participation rate, encompassing 2,59,867 Gram Panchayats across 33 States and Union Territories. 
Source: Panchayat Advancement Index (PAI 2.0) FY 2023-24 Report
State wise-analysis
- Top Performing States (Front-Runner Leadership): Tripura recorded the highest proportion of Front Runners nationwide, with 80.19% (943 GPs) reaching Grade A, followed by Telangana (624), Andhra Pradesh (591), Odisha (555), and Maharashtra (315). No panchayat could make it to the ‘Achiever’ category.
- High Consistency Models (Universal Performance Stability): Kerala (99.36%) and Tripura (100%) demonstrated near-universal categorization of their Gram Panchayats in the top two bands (Grade A + B).
- Large State Dynamics (Performer Baseline Dominance): Large demographic states such as Uttar Pradesh (18,905 Performers), Gujarat (11,963 Performers), and Madhya Pradesh (11,154 Performers) maintain the highest absolute volumes of Grade B Gram Panchayats(Panchayat Advancement Index (PAI 2.0) FY 2023-24 Report | Ministry of Panchayati Raj).
Theme wise-analysis
- Overall, 3,635 GPs emerged as Front Runners (Grade A). Sectorally, Theme 1 (Poverty Free and Enhanced Livelihoods) and Theme 2 (Healthy Panchayat) yielded the strongest outcomes, securing A+ grades for 3,313 and 1,015 GPs, respectively.
- Theme 1 (Livelihoods) consistently yielded higher top-tier (A+) grades nationally (3,313 GPs) than Theme 2 (Health) (1,015 GPs).
- States with strong rural self-help group ecosystems (such as Odisha’s Mission Shakti, Kerala’s Kudumbashree, and Tripura’s NRLM networks) outperformed in poverty reduction metrics due to direct credit linkages and employment tracking.
- States like Andhra Pradesh and Telangana score higher in Theme 6 (Infrastructure) due to dedicated state programs constructing physical Gram Panchayat secretariats and civic structures.
- Conversely, Kerala leads in Theme 8 (Good Governance) and Theme 2 (Health) due to long-term decentralization, higher local tax generation (OSR), and mature primary healthcare systems(Panchayat Advancement Index (PAI 2.0) FY 2023-24 Report | Ministry of Panchayati Raj).
Outcomes
- Targeted Local Interventions: Micro-level tracking exposed specific deficits, prompting local action such as villages in Maharashtra installing streetlights and CCTV following low marks under the “Women-Friendly Panchayat” theme, and Gujarat villages initiating intensive sanitation campaigns after lagging in the “Clean & Green” category(Lohani, 2025) .
- Evidence-Based Planning: The framework shifts planning away from random fund utilization toward structured, metric-driven Gram Panchayat Development Plans (GPDP) targeting explicit gaps in health, water sufficiency, and livelihoods. PAI has become a key tool for evidence-based planning, helping Panchayats identify and prioritise focus areas in their GPDPs(Lohani, 2026) .
- The 16th FC recommended a major 84% budget increase for Rural Local Bodies (RLBs) allocating ₹4,35,236 crore for the 2026–31 period. It broke down local body grants into an 80:20 ratio (80% Basic Grants and 20% Performance-Based Grants).PAI serves as the primary scorecard that determines whether a rural body is performing well enough to secure its share of the performance-tied budget(Saroj Kumar Mahapatra, 2026).
Impact
- Constructive competition: PAI grades every panchayat on a common scale, so GPs can see how they rank against peers in their block and district. Several states link PAI performance to recognition and awards, and some use the scores to allocate extra resources. The best performers become Panchayat Learning Centres, and other PRIs visit them to learn what works.
- Scope for improvement: Theme-wise scores show each GP exactly where it is weak, whether in health, water, governance or elsewhere. GPs can use this to set priorities in their Gram Panchayat Development Plans (GPDPs), and tracking scores year on year shows whether they are improving.
- People’s participation: Panchayats display PAI scorecards outside their offices, so residents can see how their GP performs. PAI scores are now a regular item in Gram Sabha meetings, where villagers can question the data and ask what is being done about weak areas. Data is also approved by the Gram Sabha before it is submitted, which gives citizens a say in how their panchayat is assessed.
- Localisation of SDGs: PAI turns the 17 global SDGs into nine themes a panchayat can act on. Because GPDPs must align with these themes, village plans now link to national and global goals, with scores to track progress.
Emerging Issues
- Data quality: The scores rest largely on administrative and self-reported data. Gram Sabha validation helps, but it is only as strong as the capacity and independence of the Gram Sabha itself.
- Timeliness: Data for FY 2023-24 was released in April 2026, a gap of about two years. The index is better for trend analysis than for mid-course correction.
- Uneven coverage: West Bengal is absent, and Meghalaya’s submission was partial. This weakens the “nationwide” claim and distorts state comparisons.
- Structural gaps behind the scores: According to the RBI’s 2024 report on PRI finances, panchayats raise only about 1.1% of their revenue locally, and roughly 95% comes from higher tiers. Around 60% of 15th Finance Commission grants were tied, which limits what a GP can do about a weak theme score(Press Releases | Official Website of Reserve Bank of India, n.d.) .
- Capacity and governance: PRIs lack accountants and engineers, and several states run parallel bodies and SPVs for rural works. Proxy representation of women (“Sarpanch Pati”) also persists.
- Risk of reading rank as performance: The states at the bottom, such as Manipur, Bihar and UP, start from very different baselines, so ranking alone can punish them for conditions beyond the panchayat’s control.
Way Forward
- Close the data loop faster- Shorten the gap between the reference year and the report, and use more auto-ported data to reduce manual entry.
- Bring in the missing states- Onboard West Bengal and push Meghalaya and similar states to full participation, so national comparisons mean something.
- Tie scores to untied money- Pair weak theme scores with flexible funds, so a panchayat can act on its own diagnosis.
- Invest in capacity- Build a dedicated Panchayat management cadre of development officers, accountants and engineers, and strengthen training for elected women representatives.
- Strengthen validation and audit- Support Gram Sabha validation with independent social audits, such as the Meghalaya model of a dedicated Directorate of Social Audit.
- Use it for peer learning- Link Front Runner and top-theme GPs to weaker ones, and report progress against each GP’s own previous score, not just its rank.
- Publish outcome evidence- The next step is a year-on-year analysis showing whether higher scores follow from, and lead to, real changes in livelihoods, health and services.
- Inter-Ministerial API Integration- Establish seamless, automated API synchronization across all central line-ministry databases to eliminate manual dual-entry and ensure continuous data validation on.
References
- Lohani, S. K. (2025, December 27). Panchayat Advancement Index: Strengthening data-driven decision-making | Hindustan Times. Hindustan Times. https://www.hindustantimes.com/ht-insight/governance/panchayat-advancement-index-strengthening-data-driven-decisionmaking-101766864494433.html
- Lohani, S. K. (2026, January 12). Panchayat Advancement Index: Strengthening Data-Driven Decision-Making for rural transformation. Kashmir Images – Latest News Update. https://thekashmirimages.com/2026/01/13/panchayat-advancement-index-strengthening-data-driven-decision-making-for-rural-transformation/
- Majumder, S., Chatterjee, U., & Malakar, K. (2026, October 5). India needs local climate budgets: What the 16th Finance Commission can enable. The Policy Edge. https://www.policyedge.in/p/india-needs-local-climate-budgets-what-the-16th-finance-commission-can-enable
- Ministry of Panchayati Raj. (2023). Panchayat Advancement Index (PAI) 2.0 (FY 2023-24). In Panchayat Advancement Index (PAI) 2.0 [Report]. https://static.pib.gov.in/WriteReadData/specificdocs/documents/2026/apr/doc2026429858801.pdf
- Panchayat Advancement Index (PAI 2.0) FY 2023-24 Report | Ministry of Panchayati Raj | India. (n.d.). https://panchayat.gov.in/en/document/panchayat-advancement-index-pai-2-0-fy-2023-24-report/
- Panchayat Advancement Index (PAI) 2.0 Report out: 3635 panchayats emerge as front runners. (n.d.). https://www.pib.gov.in/PressReleasePage.aspx?PRID=2256616®=48&lang=2
- Press releases | Official website of Reserve Bank of India. (n.d.). https://www.rbi.org.in/Scripts/BS_PressReleaseDisplay.aspx?prid=57182
- Saroj Kumar Mahapatra. (2026, March 13). 16th Finance Commission pushes Panchayats towards greater fiscal autonomy and accountability. Down to Earth. https://www.downtoearth.org.in/governance/16th-finance-commission-pushes-panchayats-towards-greater-fiscal-autonomy-and-accountability
About the Contributor
Ravirala Lahari is a Public Administration and Governance postgraduate from the Central University of Karnataka, with a keen interest in Urban Governance, Public Policy, and Sustainable Development. Committed to making governance more inclusive, sustainable and having a tangible impact on citizens’ lives.
Acknowledgement
I am writing to express my sincere gratitude to IMPRI (Impact and Policy Research Institute) for providing me with the opportunity to prepare this policy update article and for fostering a rigorous learning environment that connects research with public policy practice.
Reviewers
Nivedya and Mannat
Disclaimer
The views and opinions expressed in this article are solely those of the author and do not necessarily reflect the views, policies, or positions of IMPRI (Impact and Policy Research Institute) or any other affiliated organisation.
Read More at IMPRI :
Green GDP and India’s National Green Hydrogen Mission: Assessing the Roadmap to 2030