







Anushree Khare
Background
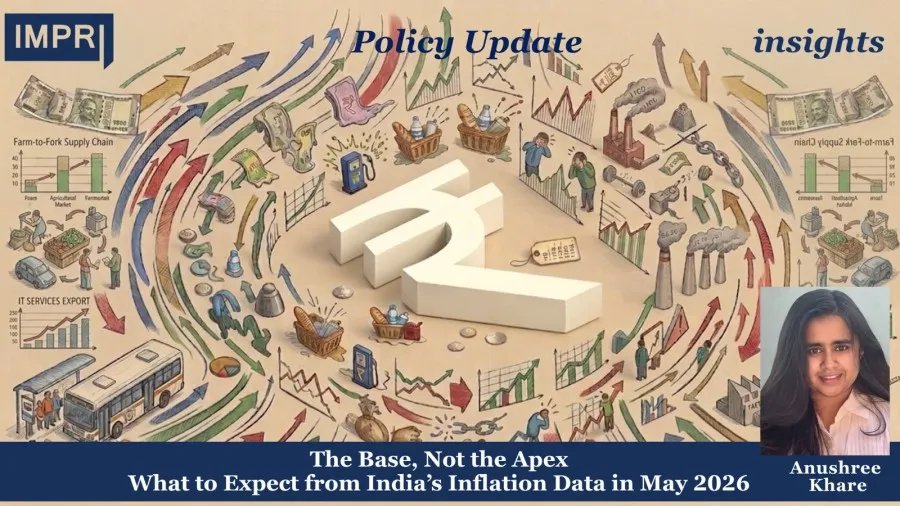
The official Consumer Price Index (CPI) data released by the Ministry of Statistics and Programme Implementation (MoSPI) showed that India’s headline retail inflation rose to 3.93% in May 2026, up from 3.48% in April 2026.
While inflation remains below the Reserve Bank of India (RBI) 4% target. However, the way inflation has developed in terms of composition and its relationship to a surging Wholesale Price Index (WPI) may represent the true value of inflation developing further down the line.
Therefore, instead of focusing on whether inflation exceeded RBI’s target for May, the most important issue will be if the factors that have kept inflation in check can hold.
More Than Just the Number
Headline retail inflation was virtually identical to core inflation in May 2026, which was estimated at 3.9%.
Core inflation tends to be viewed as representing more sustainable demand-side influences and less of the effects of “noise” that can affect inflation numbers.
When core inflation is near equal to headline inflation near a target level, then headline inflation levels are likely not remaining low due to favorable base effects or transitory corrections in food prices, but due to relatively consistent underlying pressures for demand that would easily turn upward with another economic shock.
That potential shock is already present geographically.
- While Urban inflation went up from 3.2% to 3.5%,
- Rural inflation went from 3.7% to 4.25%, which is above RBI’s target inflation rate.
The difference represents a rural–urban spread of up to 80 basis points, which is among the largest in the recent time-series and is indicative of the disproportionate impact of rising food and fuel prices on rural consumption baskets where those two categories tend to account for a larger share of spending.
- Personal Care, Social Protection & Miscellaneous Goods & Services had an inflation rate of 18.5%, largely due to Gold Prices increasing 41%, and Silver Jewelry prices increasing 155%.
- Restaurants & Accommodation Services had an inflation rate of 5.75%.
- Transportation had a positive print of +1.75% in May having been -0.01% in April.
This transportation inflation print was the first positive in many months, as higher fuel prices globally began to pass through into consumers’ pockets.
The personal care inflation print is primarily a valuation effect vs a demand effect and should not be confused with the broader trends in inflation; whereas the transportation and restaurants prints are more policy relevant as they directly reflect the consumer price impacts of higher global energy costs due to unrest in West Asia.
Food Inflation Is Broadening, Not Just Stabilizing
Food Inflation (CFPI) has been positive since January 2026 and hit 4.8% in May 2026. Food and Beverages Inflation is positive as well, with an inflation rate of 4.5%.
What changed was the following
- Protein-Rich Items’ contribution to CFPI dropped from 44.2% in March to 33.2% in May,
- Vegetables’ contribution rose from 8.4% to 17.7% during that same time frame.
- Similarly, Processed Foods contributed more to CFPI, increasing their contribution from 10.8% to 12.7%.

A significant change occurred here. Protein-Rich Item-based inflation prints tend to be considered supply-side or seasonal phenomena that are subject to correction.
The fact that inflation pressure is moving beyond proteins to include vegetables, processed foods (and to a smaller degree) edible oils means that inflation is spreading across different segments of the food basket rather than clustering around specific ones.
Specifically within vegetables, tomato prices rose by 48% YoY in May (while potatoes deflated by -23.7% and Pulses declined by -1.8%), suggesting that the overall vegetable price increase is not uniform across all types of vegetables; therefore, when tomato seasonality returns, that portion of vegetable price increases could reverse quickly.
The WPI-CPI divergence is the more urgent signal
In May 2026’s WPI recorded an inflation of 9.68% while CPI was 3.93%.
- Retail inflation (CPI) increased by just 45 basis points from April to May.
- Wholesale inflation (WPI), however, shot up by nearly 142 basis points in the same time frame.
- The WPI-CPI divergence is 575 basis points.
This is the most direct evidence that the cost pressures have not yet fully transmitted to consumers.
These inflationary pressures were largely caused by increases in the costs of raw materials:
- Crude Petroleum & Natural Gas saw an inflation of 61.5%,
- Mineral Oils 49.8%,
- Basic Metals 12.3%,
- And Chemicals & Chemical Products 13.4%.
These are all input-side categories. Historically, such a large divergence will resolve itself either through producers absorbing these higher costs through lower profit margins or the cost being transferred down the production chain into consumer prices.


Given the nature of the West Asia-based crude oil price shock, there is no reason to believe that producers can simply absorb these shocks indefinitely. Therefore, we expect to see a transfer of these cost increases into retail prices during the next one to two quarters.
Furthermore, based on historical trends and the understanding of the nature of this particular shock, it is believed that retail inflation still has upside potential that has not yet manifested in the May CPI report.
Monetary policy is positioned for this asymmetry
Monetary policy committee decision-making reflects this asymmetry.
At their June 2026 meeting, the MPC voted to keep the Repo Rate at 5.25% and maintained a neutral stance toward interest rates, citing “energy price uncertainty,” “supply-chain disruptions” and “geopolitical risks.”
In addition, the RBI has lowered its forecasted real GDP growth rate across from 7.0% to 6.6% for FY27; the RBI also raised its forecasted CPI inflation rate for FY27 from 4.5% to 5.1%, with CPI inflation peaking at 5.9% in Q3FY27 and then easing thereafter to 5.0% by the end of FY28.
Thus, the central bank’s forward guidance underscores a data-dependent approach, maintaining policy flexibility until the projected Q3 peak subsides.
Monsoon Deficits and the Retail Food Outlook
The food inflation numbers shown above are based on a May report, but this is during a time when planting for the crop year is still well behind what we normally see.
Therefore, our focus turns to the percentage of land planted by June 26th.
- The total land area planted was 22.7 percent less than it was at the same time last year.
- Planting for food grains was 21.1 percent less than the prior year.
- Oilseed planting was an astonishing 53.4 percent less than it was at the same time last year.
The Indian Meteorological Department has reported that there will be 90 percent of the long-term average amount of rainfall during the season.
There is a 43 percent chance that there will be less than average rainfall in the “Monsoon Core Zone.” This zone includes about 70 percent of all of India’s rain-fed acres.
Through June 28th, the cumulative amount of rainfall had been 43 percent less than the average amount for the entire season. Also, 74 percent of the country’s meteorological subdivisions received either deficient or large deficient amounts of rainfall.

As you can see, a deficiency of this nature for oilseed and food grain plantings does not affect CPI reports for many months; it affects CPI reports when these crops come into market in late October/early November.
Furthermore, data shows that vegetable and edible oil have made significant contributions to the increasing trend in food inflation through May. Vegetable prices contributed 17.7 percent of the increase in food inflation, and edible oil prices added approximately another 15-17 percent.
A poor kharif harvest will add pressure to the already increasing trends in these product groups rather than create a new source of pressure.
The Structural Cushions and Price Limits
There are two cushions available right now to absorb the potential negative impact caused by a poor kharif harvest. Both need to be clearly identified and defined to avoid assumptions.
- Reservoir water levels were 5.7% above normal levels as of June 25.
- Additionally, food grain stockpiles (rice and wheat combined) represented four-and-a-half times the required buffer stock norms as of June 25.
These factors provide evidence that producers may respond to reduced rainfall with additional production efforts, thus providing a cushion against the effects of reduced rainfall.

Separate studies done by CareEdge Research were referenced in the same data release showing that the sensitivity of agricultural GDP and overall GDP to deviations in rainfall decreased significantly over the past twenty years primarily because of improvements in irrigation systems and farming techniques.
Decreasing sensitivity to rainfall on the side of output, however, indicates that farmers’ ability to produce output despite poor weather conditions has improved.
However, decreasing sensitivity to rainfall does not indicate that producers are able to mitigate price increases for their products, especially perishable items such as vegetables and edible oils. In addition, since India imports most edible oils, there is a direct relationship between India’s domestic edible oil production and world edible oil prices.
The rapid price increases for tomatoes and cabbages evident in May’s data releases indicate that larger price increases are anticipated if kharif sowing does not improve over the remainder of July and August.
Therefore, food inflation readings taken today should be viewed as minimums and not maximums on the monsoon channel. As noted earlier, the MPC projects an upper limit of 5.9 percent on CPI inflation in Q3 FY27, which already takes into account some portion of this anticipated effect.
Whether the actual result exceeds or meets this estimate will depend upon how much rainfall improves over the next seven-to-eight weeks, a window that remains subject to emerging El Niño conditions as noted by IMD.
Conclusion
Three factors will influence how much the Indian inflation path (or inflation rate) is stabilized at the target or breached through FY27.
- The first factor is the speed and amount of correction in Brent crude – while Brent crude was priced above $120 per barrel at the peak of the crisis in April, the price averaged $89.4 per barrel as of June 23rd, declining below $80 per barrel later in the month. However, the EIA’s June Short-Term Energy Outlook forecasted higher levels for oil production shut-ins for all months of the projection period, which implies the drop in Brent crude prices may not last.
- The second factor is how much pass-through occurs on top of the existing wholesale price increase seen in the data, compounded with food price risk generated from the Monsoons.
- Neither of these two factors suggests there is a disinflationary environment.
Therefore, the 3.93% inflation read in May should be viewed as a floor test, rather than a sustaining level of inflation, a bounded number resting upon increasing pressures that both the RBI’s inflation forecasts and the WPI-CPI gap are anticipating.
References
Department of Economic Affairs. (2026, June). Monthly Economic Review: June 2026. Ministry of Finance, Government of India. [https://dea.gov.in/files/monthly_economic_report_documents/Monthly%20Economic%20Review%20June%202026.pdf]
India Meteorological Department. (2026, June). Monsoon Rainfall Tracking Report. Ministry of Earth Sciences, Government of India. [https://mausam.imd.gov.in/responsive/monsooninformation.php]
Ministry of Agriculture & Farmers Welfare. (24-7-2026). Kharif Sowing Progress Report [https://upag.gov.in/dash-reports/progressivecropareasown]
Ministry of Statistics and Programme Implementation. (2026, May). Consumer Price Index (CPI) Provisional Data Release: May 2026. Government of India. [https://www.mospi.gov.in/themes/product/9-consumer-price-index-]
Office of the Economic Adviser (OEA), DPIIT. (July 16, 2026). Wholesale Price Index (WPI) Commentary [https://eaindustry.nic.in/uploaded_files/wpi/WPI_PPIs_Meta_Data_20260716.pdf]
The Hindu. (2026, June 5). RBI Monetary Policy Committee Meeting: Decision on interest rates, June 2026. [https://www.thehindu.com/business/Economy/rbi-monetary-policy-committee-meeting-decision-interest-rates-june-5-2026/article71063873.ece]
U.S. Energy Information Administration (EIA). (March 10, 2026). Short-Term Energy Outlook [https://www.eia.gov/pressroom/releases/press584.php]
About The Contributor
Anushree Khare is a Research & Editorial Intern at the Impact and Policy Research Institute (IMPRI). She holds a B.A (Hons) degree in Economics with Research. Her academic and professional interests lie in the domains of finance, quantitative research, data-driven policy analysis, and business strategy.
Acknowledgement
The author extends sincere gratitude to the IMPRI team for their guidance and support along with the reviewer Ms. Lubina Dua and Ms. Rakhi Kumari for her valuable feedback and insights.
Disclaimer
All views expressed in the article belong solely to the author and not necessarily to the organization