



Arun Kumar
The methodology that has been used to compute the GDP does not capture the decline in the economy in a quarter when the economy suffers a shock. The previous year’s good performance is projected and the indicators are boosted by price rise.
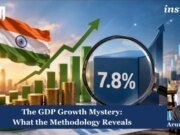
Government of India, through its agency Ministry of Statistics and Programme Implementation (MoSPI) has released the data for Quarterly Estimate of Gross Domestic Product (GDP) for the First Quarter of 2026-27, that is for the period April to June of 2026. It shows a high growth rate of 7.8% compared to 6.9% in Q1 of previous year, 2025-26. This is surprising since Q1 of 2026-27 contained the months April and May when the economy was impacted by the West Asia crisis which led to a drastic reduction in availability of crude oil and gas from that area. Pre-war 20% of the world supplies came from there and of that India was a major recipient.
So, the government has claimed a resounding success for its economic management. The prime minister immediately said “doomsayers were doomed and India bloomed yet again”. Indeed so if the data is correct.
What happened?
The government curtailed supply of gas to some industries and consumers in the unorganised sector had to pay a black price for the gas they used at home. This black price paid by workers is not reflected in the consumer price index. Their budget was completely disrupted and there were protests in various parts of the country.
Many hotels and restaurants closed and the price of food at those eateries that functioned increased substantially. This should have reflected in prices and output.
A lot of fertiliser, aluminum, helium, chemicals, etc., also come from West Asia and they were in short supply. Thus, there was a disruption of supply chains and rise in prices of these items. Farmers complained of shortage of fertilisers and of having to pay black prices. Diesel also had to be obtained in black thus raising the cost of production for farmers. Supply chain disruption does impact production.
In brief, prices were higher than shown by official data and production of services and manufacturing was impacted. This is not reflected in the official Q1 data released now. Is this deliberate to present a positive image of the government? And how does this come about in the official data?
The data
The tertiary sector is shown as growing at 10%. So, no impact of reduction in hotels and restaurants and in travel. Secondary sector has registered a growth of 8.6% with no impact of supply disruptions, gas shortage and workers migrating to their villages and workers protesting in many part of the country. Only the primary sector was a laggard, growing at 2.9% with mining declining at 2.4%.
On the expenditure-side, Private Final Consumption Expenditure (PFCE) registered a growth of 7.1%. No impact of price rise leading to cut back in consumption by the unorganised sector workers. Surprisingly, Gross Fixed Capital Formation (GFCF) recorded double-digit (11.9%) growth against the growth of 5.8% last year Q1. This, in spite of continuing low capacity utilisation shown by the Reserve Bank of India (RBI) data. And, given the outward flow of Foreign Institutional Investors (FII) and negligible net Foreign Direct Investment (FDI) into the country. And, there were challenges in the stock markets and the rupee was declining causing terrible uncertainty in the economy.
It is clear that the negativity about the economy is masked by the data. The workers’ protest, etc., is not reflected by the GDP data. The recent Gen Z protest was not only about question paper leaks and cheating in exams but they also raised the issue of educated unemployment. If the growth has been so good, then why has unemployment remained a big challenge for the economy?
Methodological boost
The mystery is resolved when one looks at the methodology of quarterly estimation of GDP. On p.6 of the MoSPI Press release, the Methodology mentions:
“… Quarterly Estimates of GDP is based on Benchmark-Indicator methodology in which the estimates computed for the previous financial year are extrapolated using the relevant indicators …. follow the guidelines, standards as mentioned in Quarterly National Accounts Manual of International Monetary Fund (IMF), 2017.”
So, most of the data for GDP estimation is a ‘projection’ from the previous financial year. It is not based on the data obtained from the relevant quarter.
How is the projection done? Using 33 ‘relevant indicators’ listed in the Annexure. What are these indicators? They are categorised broadly as, ‘Production-side Indicators and Price Indices’ and ‘Expenditure-side Indicators and Price Indices’. But, most of them are from the organised sector and they include the prices.
Two implications follow. First, the unorganised sector is substantially proxied by the organised sector. And when data on tax and export and import is used this contains the price in it and cannot represent real growth.
So, critically, this method does not capture the decline in the economy in a quarter when the economy suffers a shock. The previous year’s good performance is projected and the indicators are boosted by price rise.
Conclusion
As this author has been pointing out, during the demonetisation, the official growth rate turned out to be highest for that decade when everyone saw the decline in the economy for at least 5 months. Further, due to the two different methods for calculating GDP, discrepancy between them have been high since 2016-17. Now, the discrepancy has changed from +0.8% last year to -0.8% of GDP. A swing of 1.6% of GDP. So, whenever the economy experiences a shock, the GDP data shows a robust economy while there is a brewing crisis in the lives of the unorganised sector.
About the Authors:
Arun Kumar taught Economics at JNU and is the author of Indian Economy’s Greatest Crisis: Impact of the Coronavirus and the Road Ahead.
This article was first published in The Wire as How the Mystery of GDP Growth in a Crisis is Resolved When One Looks at the Methodology on 2nd September 2026
Disclaimer: All views expressed in the article belong solely to the author and not necessarily to the organisation.
Read more at IMPRI:
Nagaland Department wise Schemes Update 2026
Acknowledgement:
This article was posted by Ninchen Tamang, a Research and Editorial Intern at IMPRI.